Tracelight
See every step
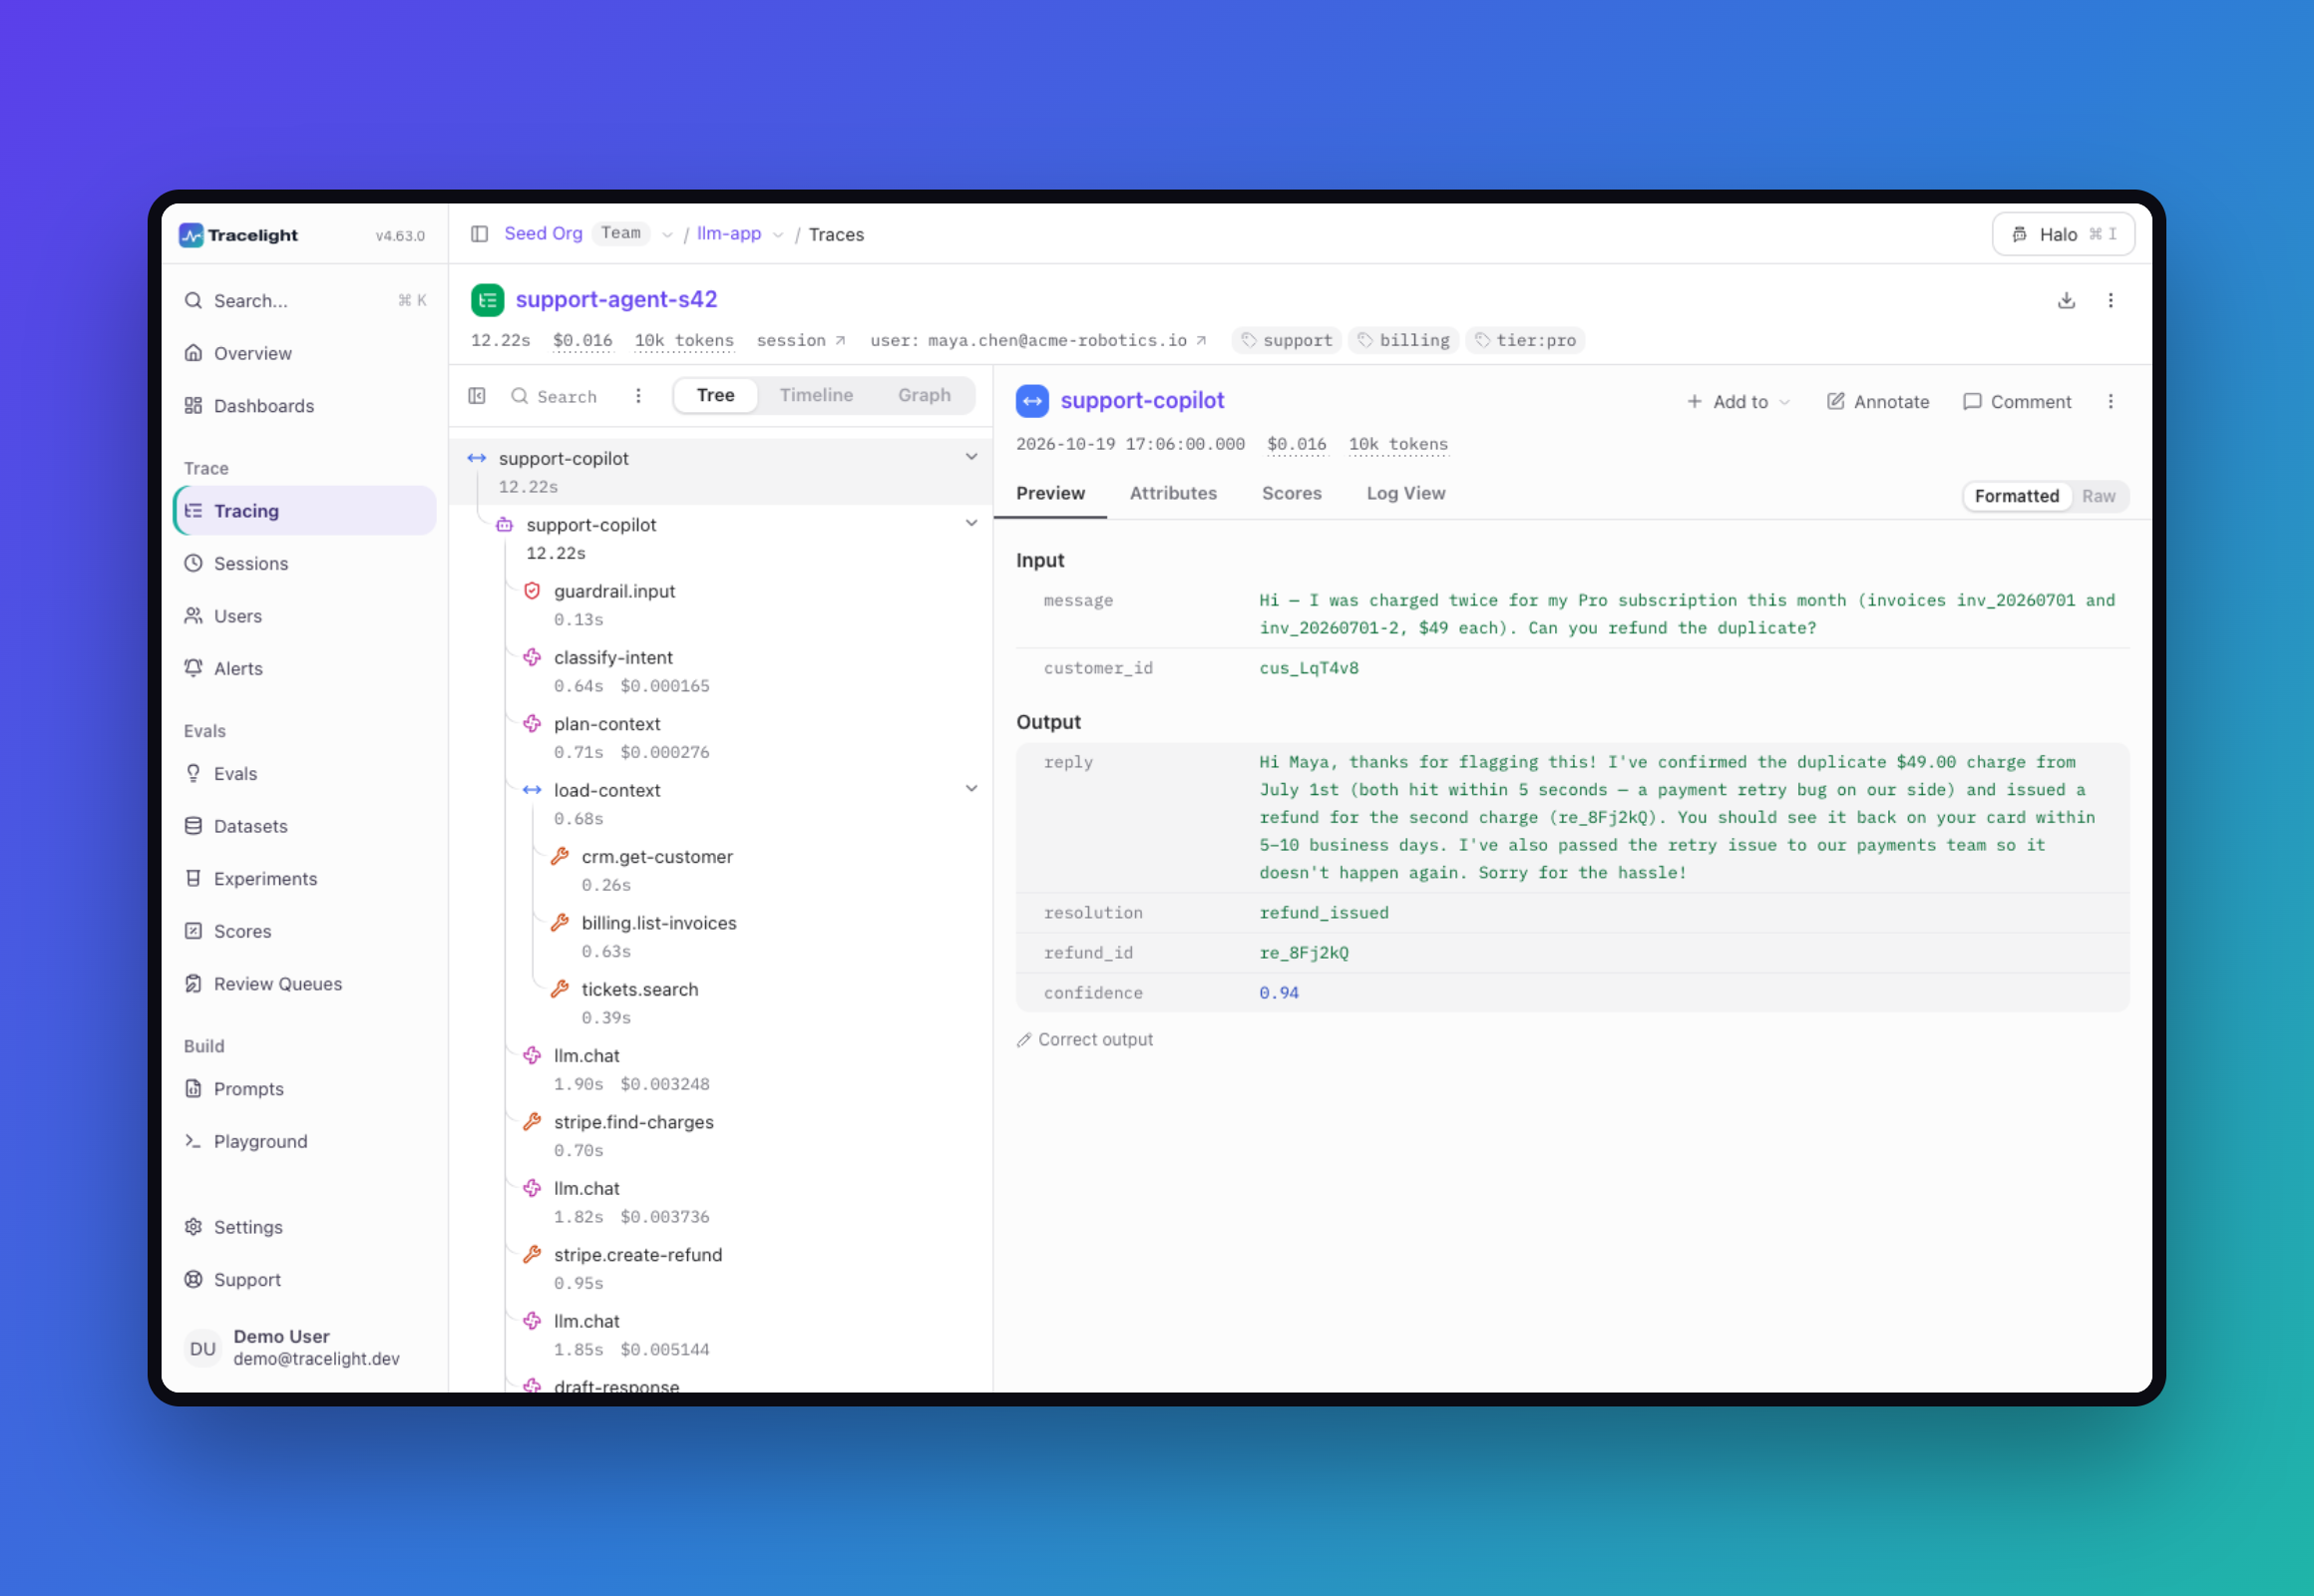
The large view above is one support-agent trace: a nested tree of every guardrail, model call and tool call, with the latency, cost and token count of each step beside it.
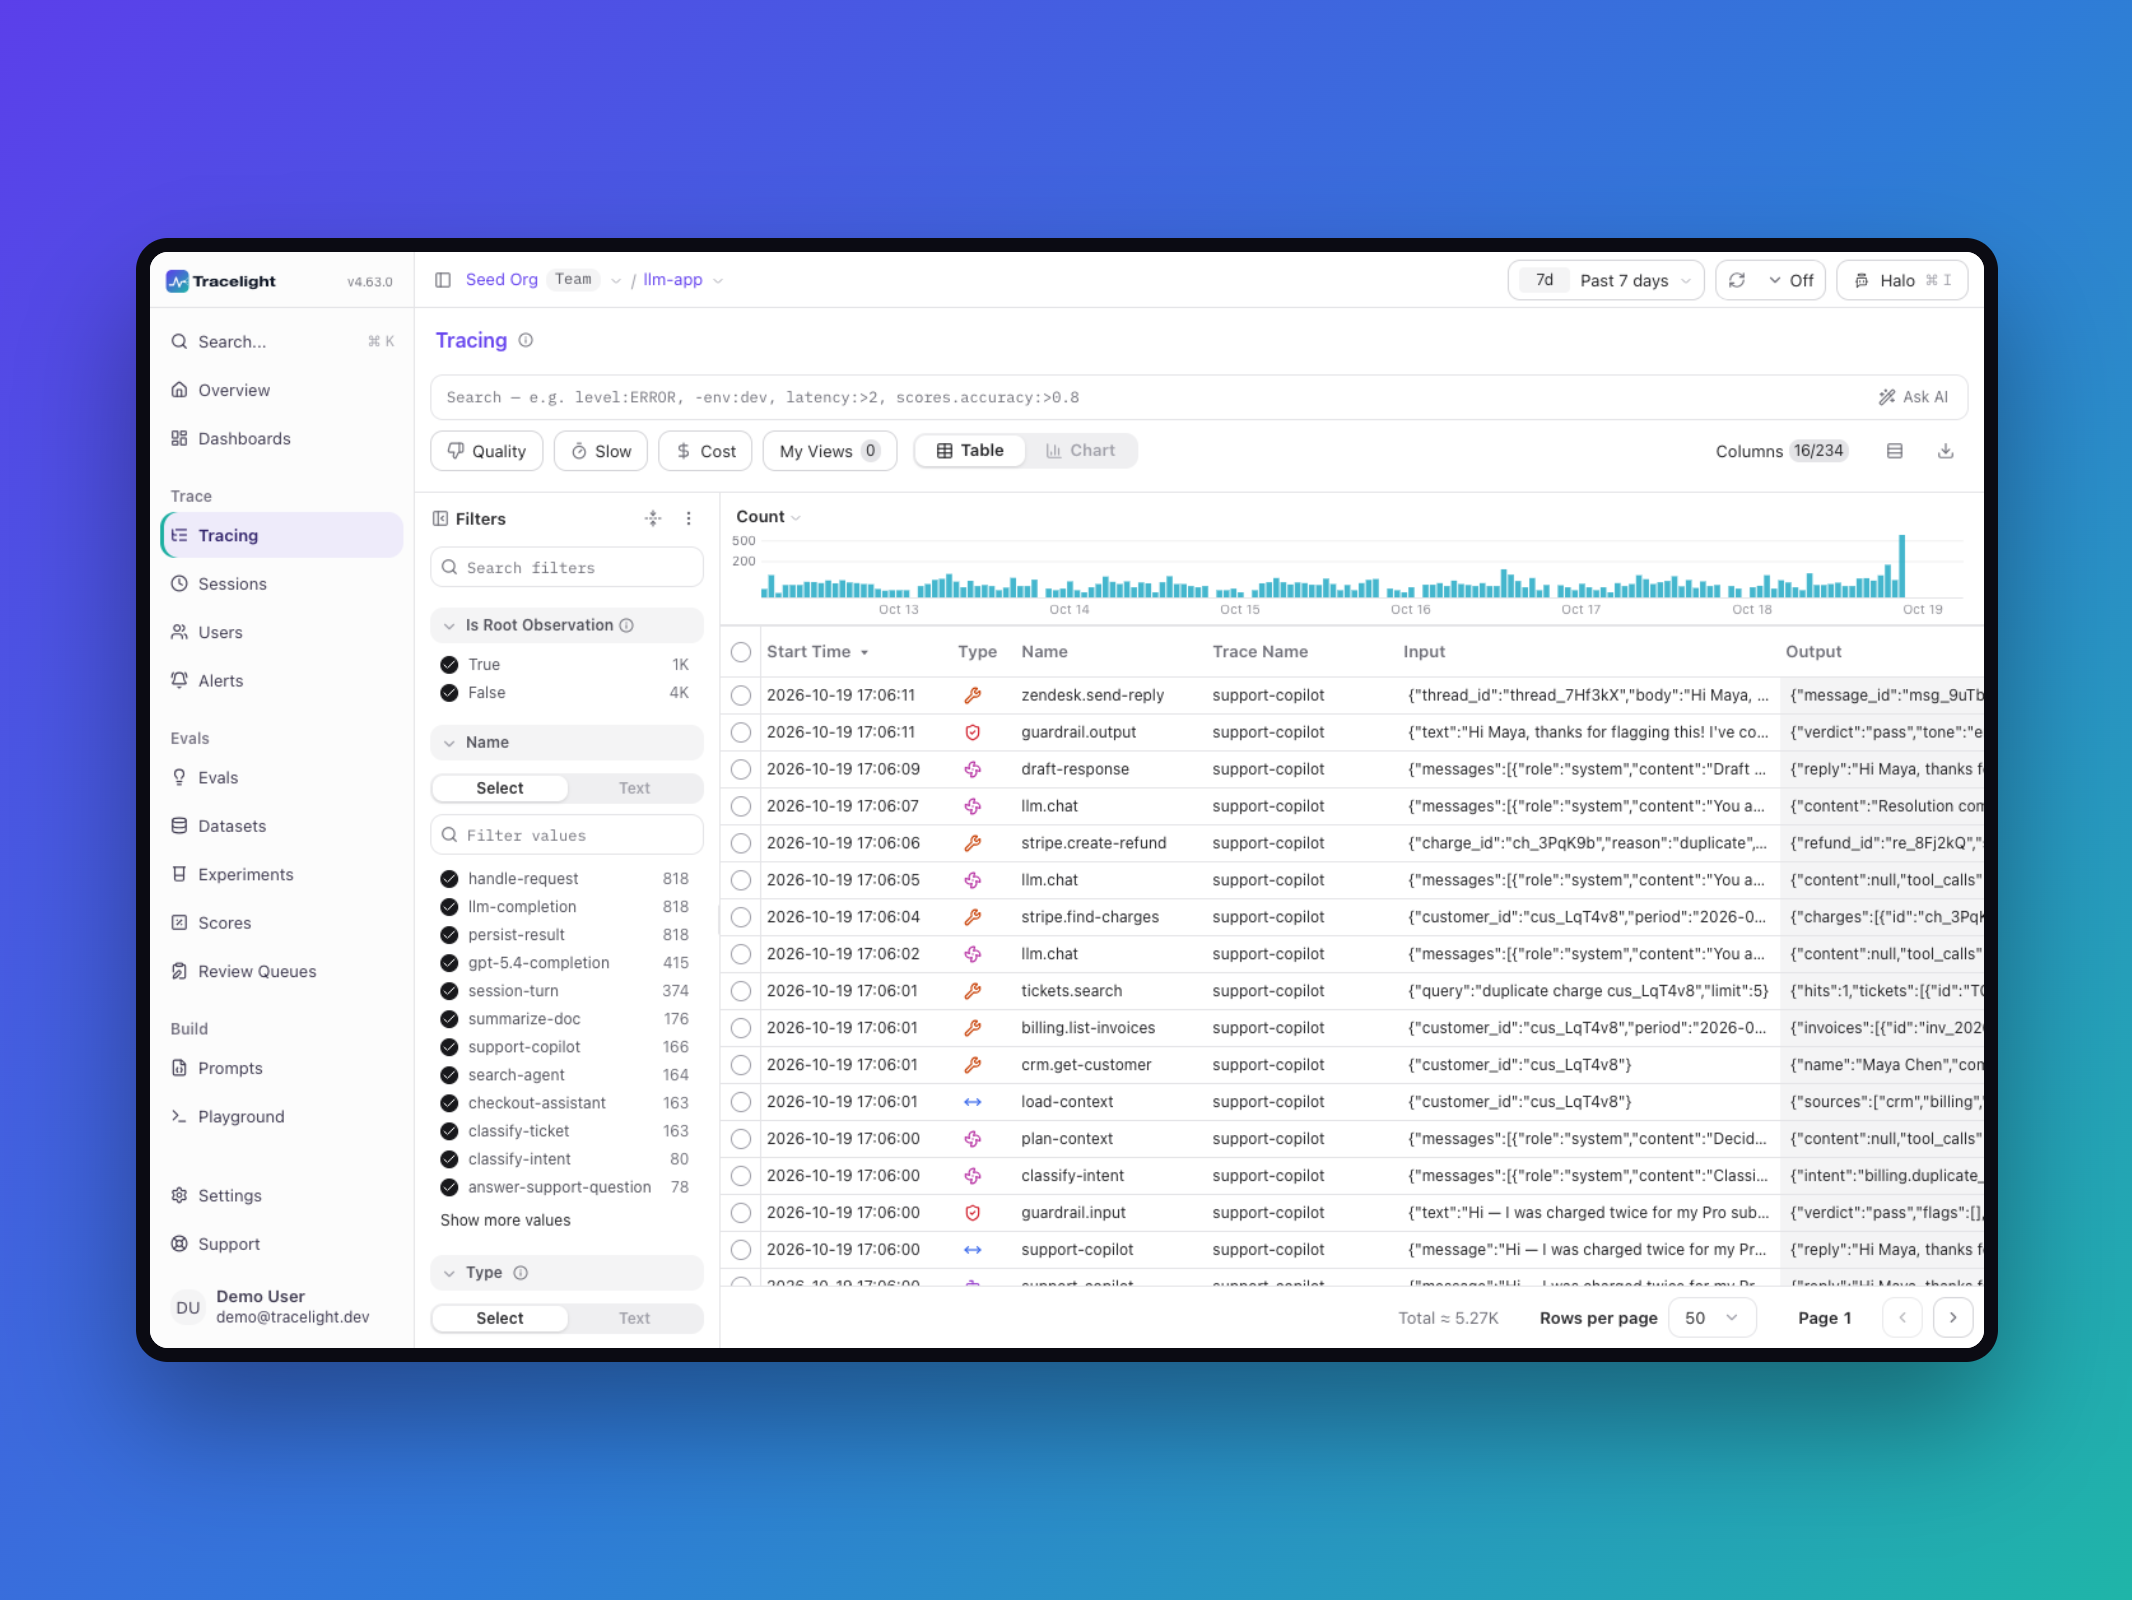
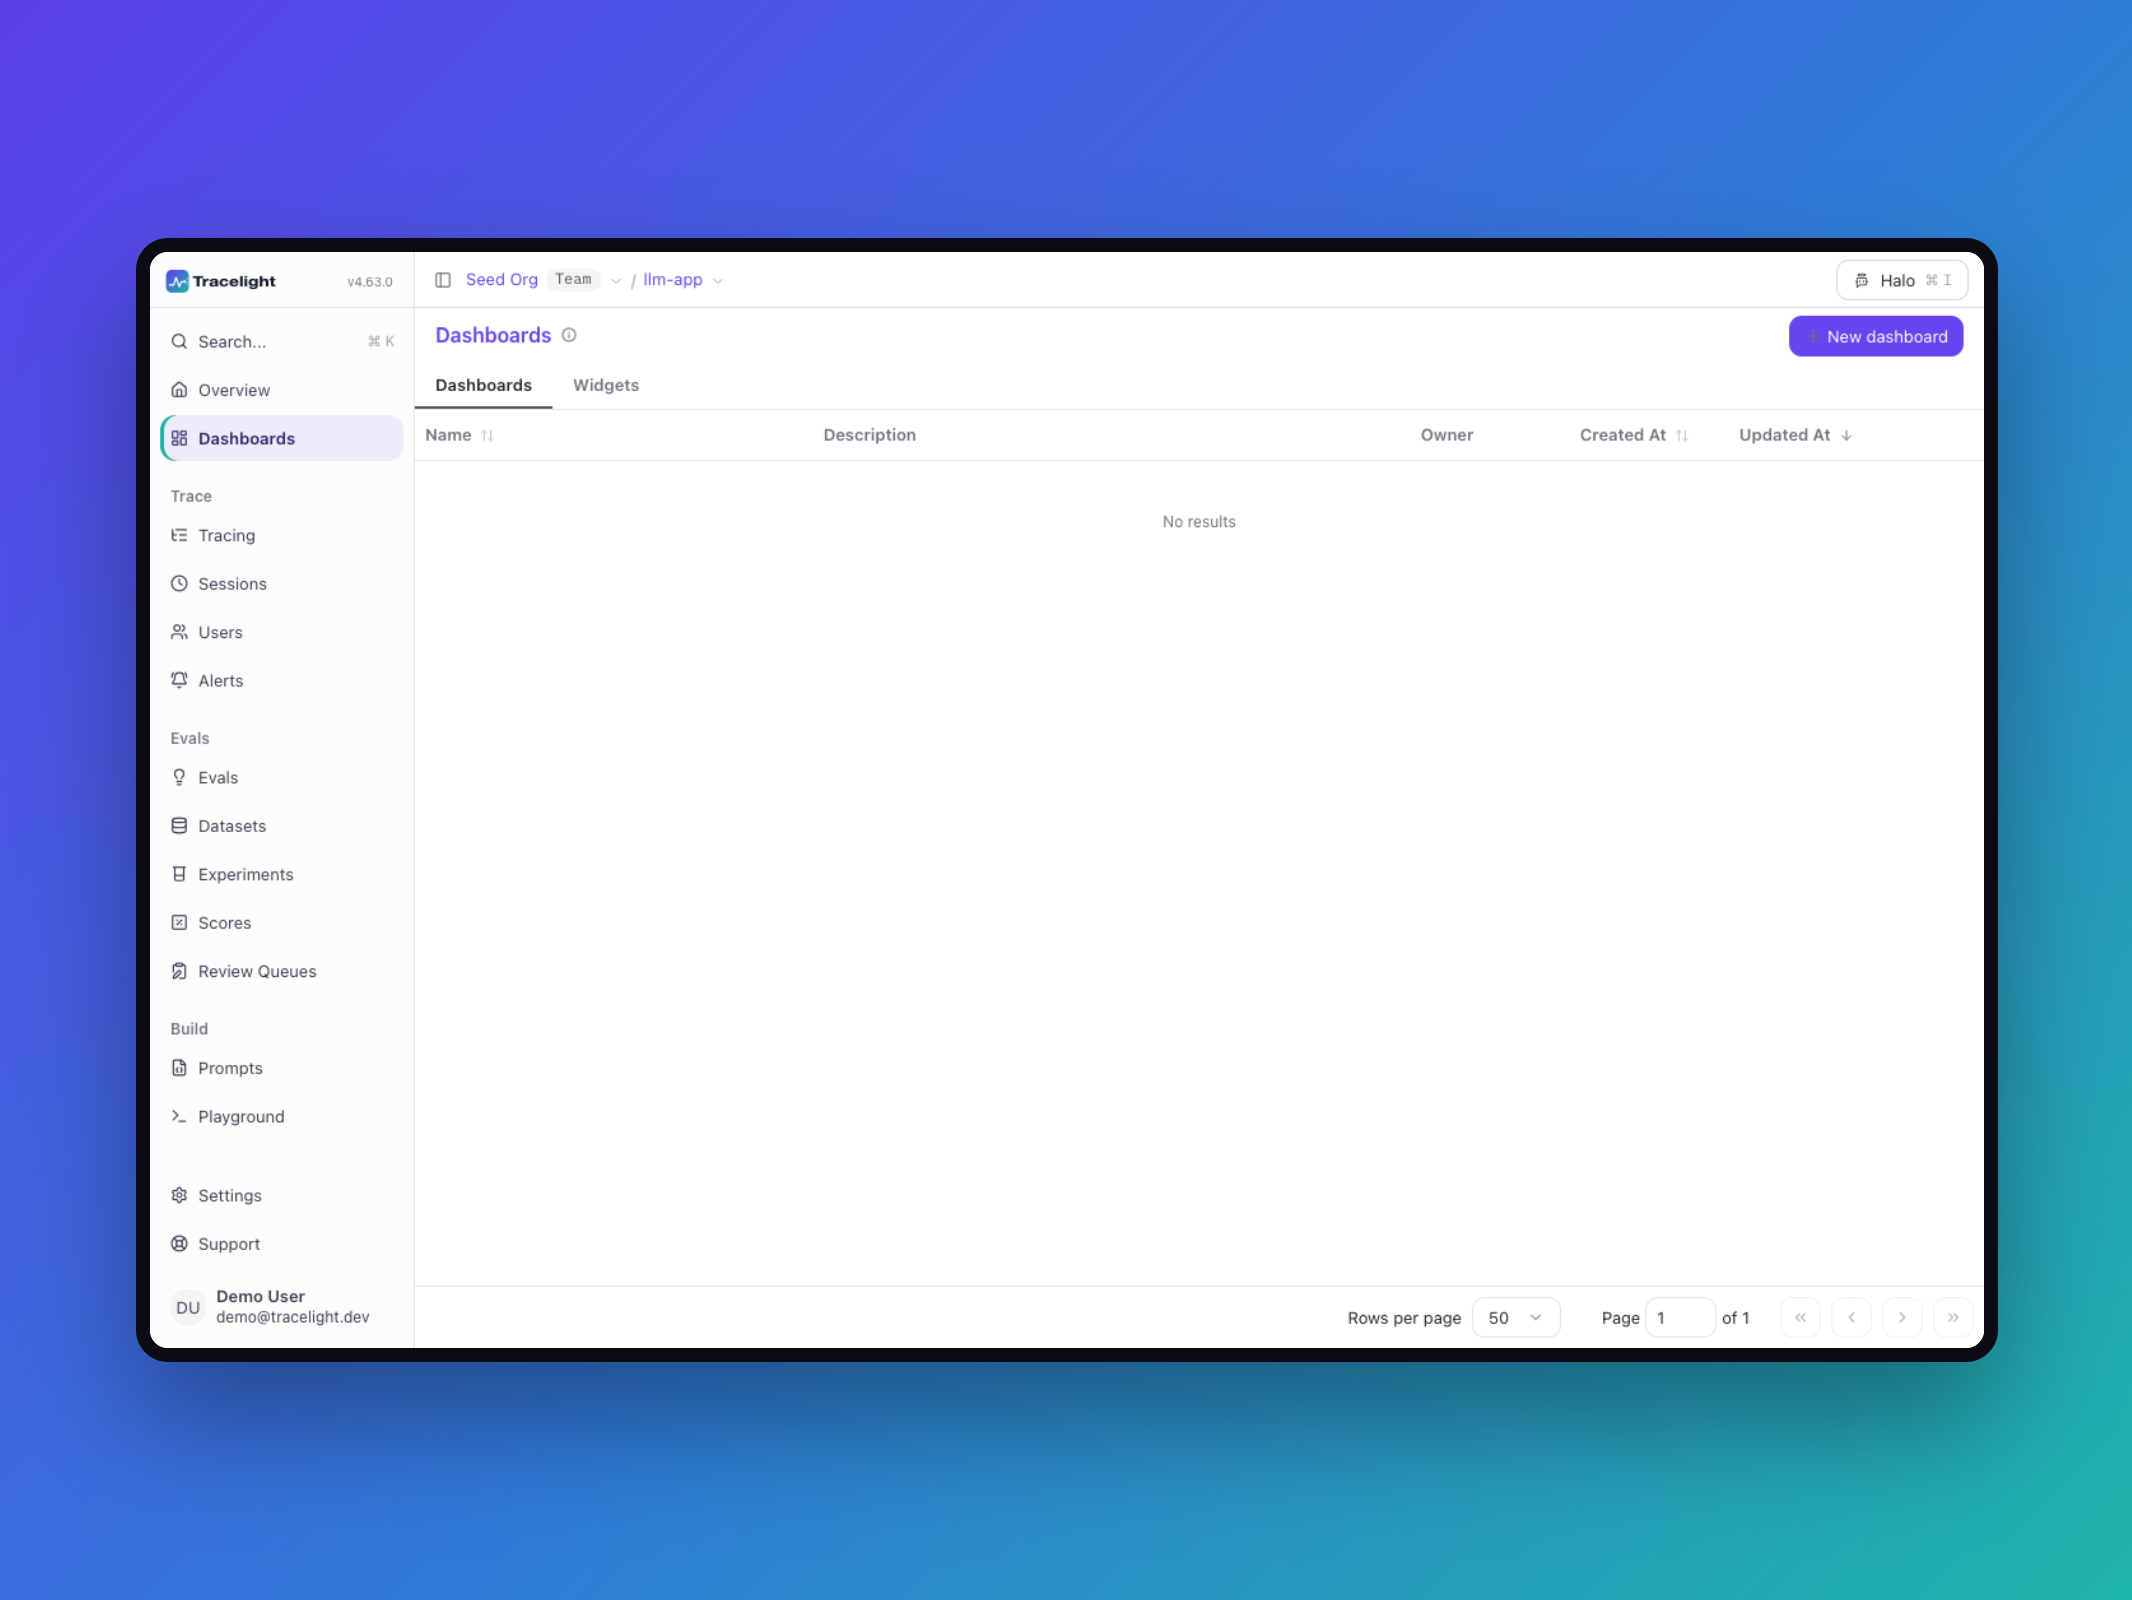
The two views below show the tracing table, which lists every call across the project, and the dashboards, which chart cost, latency and quality over time.
Score what matters
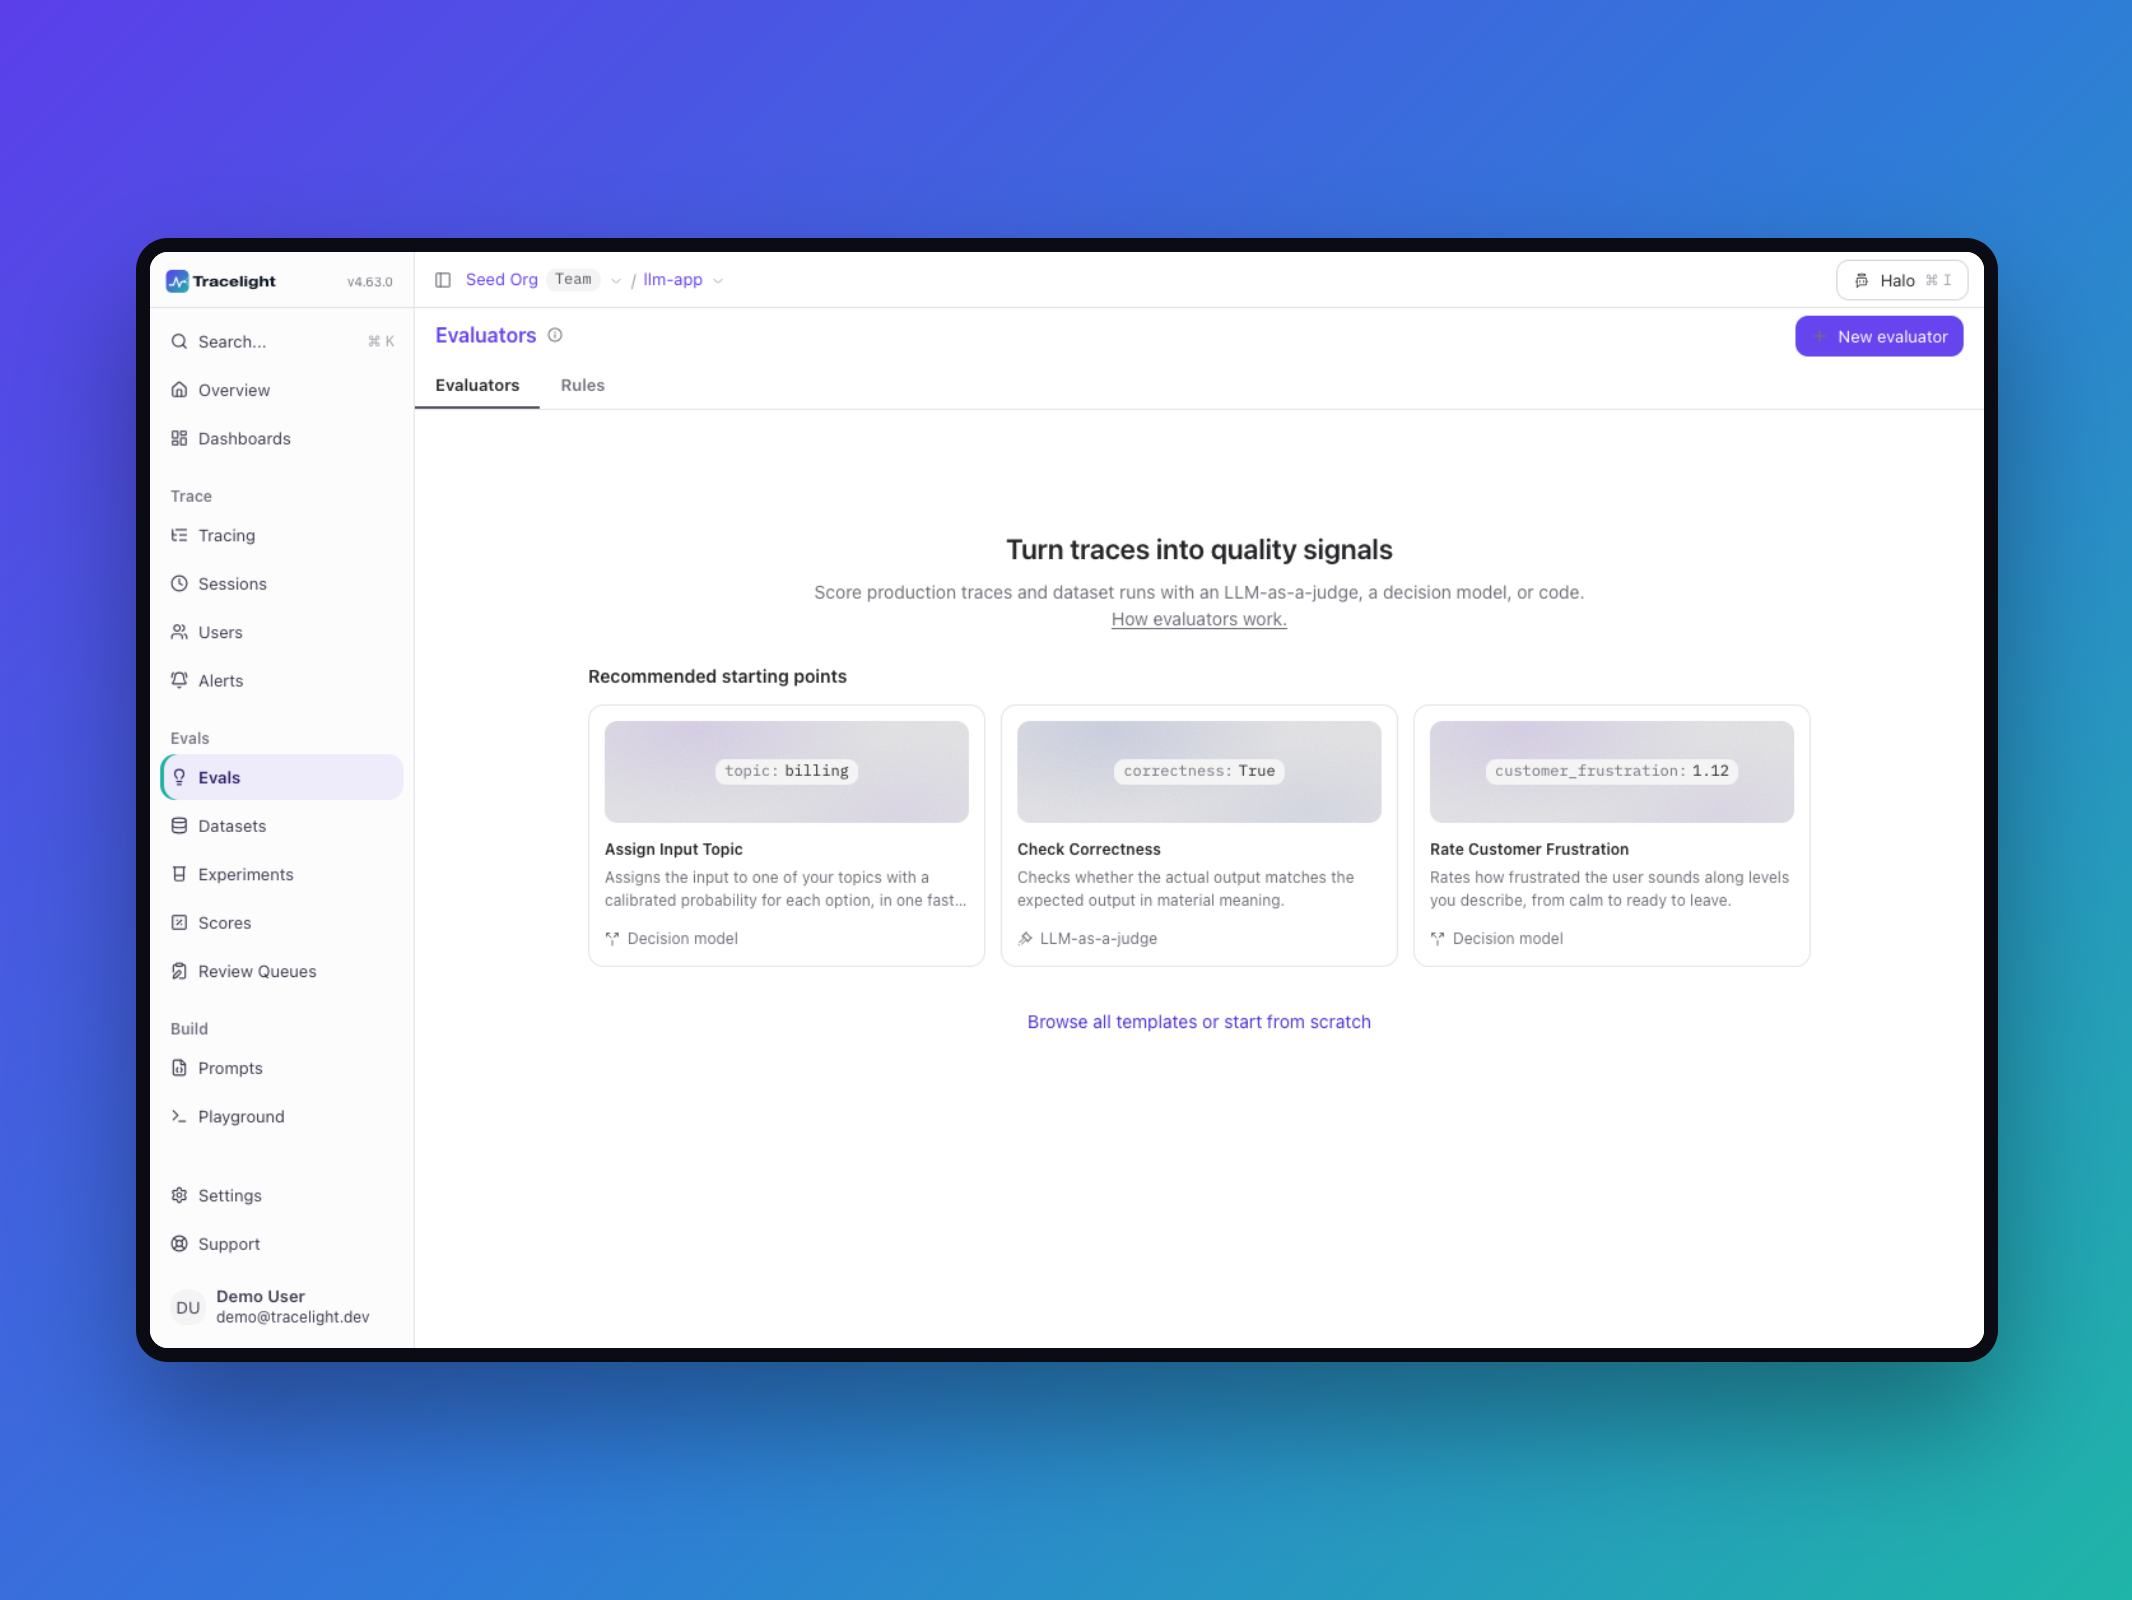
LLM-as-a-judge evaluators and human review queues score every answer automatically, so quality becomes a number you can track over time.
Scores attach to traces and datasets, which turns a vague feeling that answers got worse into a chart you can act on.
Ship prompts safely
Prompts are versioned and labelled, then tested in a playground before they reach production, with every run linked back to its trace.
Datasets built from real traces power experiments that compare two prompts or models side by side on the same inputs.
Under the hood
Tracelight is a Next.js and TypeScript app with ClickHouse, PostgreSQL and Redis behind it, so it stays fast on large volumes of traces.
Data arrives over OpenTelemetry or a REST API. The evals screen below shows evaluators that turn production traces into quality scores.
Open source
The full code and a two minute walkthrough video are on GitHub, along with screenshots of every screen.
Highlights
A clean indigo and teal interface, a sidebar grouped into Trace, Evals and Build, traces as the landing page, and a seeded demo with docs and a walkthrough video.